How to use the Viz in Tooltip feature in Tableau
With the release of Tableau 10.5, a much awaited feature has been made available to us - I am of course talking about the Viz In Tooltip feature.
This feature allows us to augment our data and add another layer of detail to our data visualization in a neat and minimal manner.
It is actually a fairly straight forward process and below are the steps that we need to follow:
This is the Viz that you will be embedding onto your main Viz and will be visible as you hover or click as a tooltip. As an example, in my cryptocurrency visualization - the circulating volume growth is the Tooltip Viz that I want to be displayed.
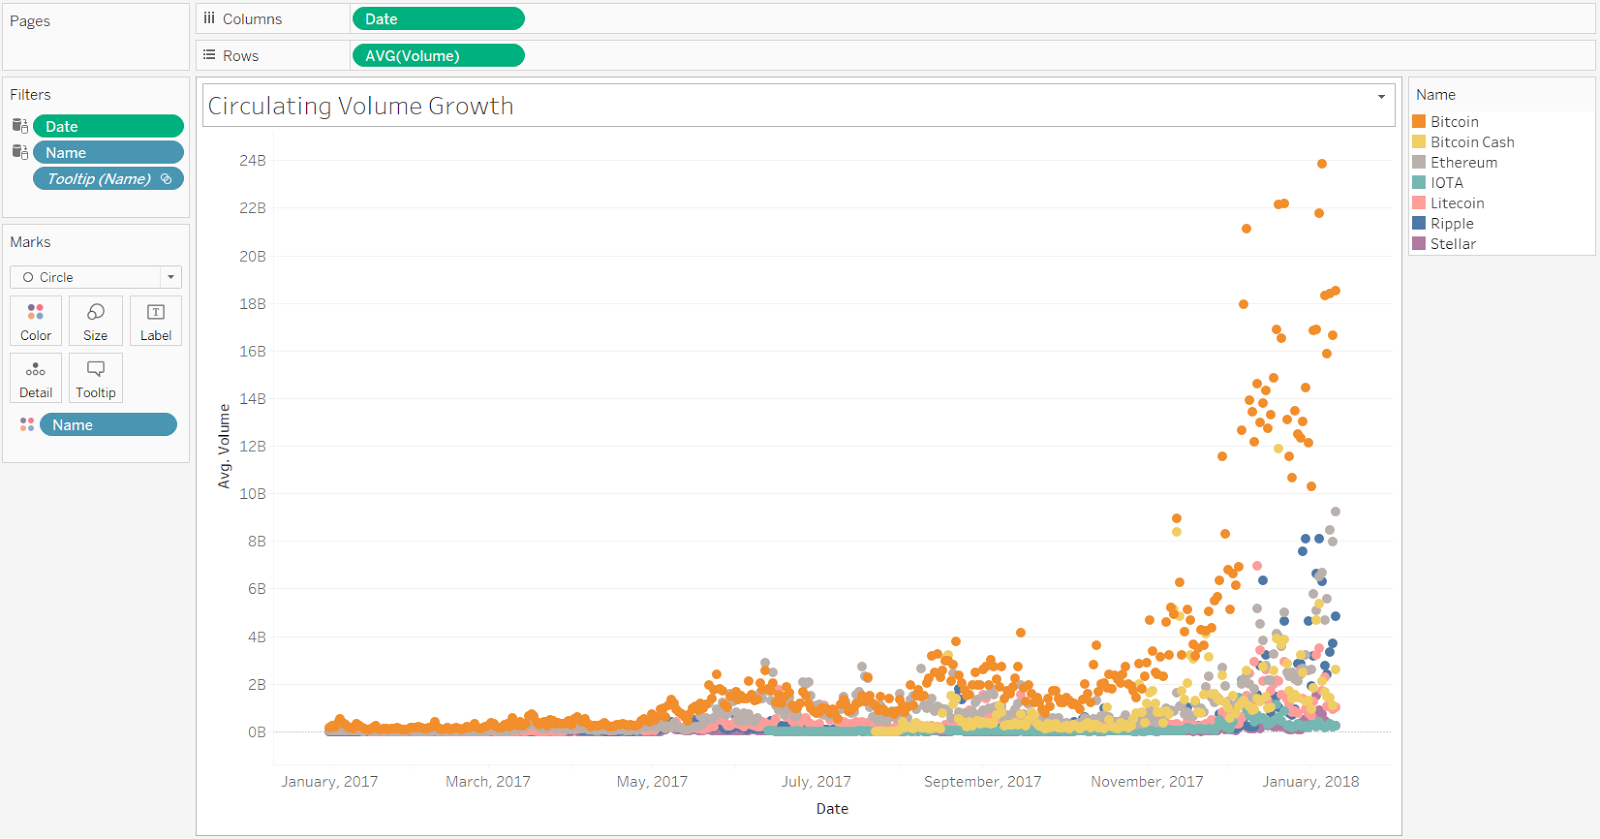 |
| Tooltip Viz |
Step 2 - Add the Tooltip Viz as a tooltip in your 'Main' Viz
Navigate to your main viz and in the 'Marks' section, click on the tooltip option which will open an 'Edit Tooltip window'.
Here, click on the Insert drop down sub menu and go to Sheets and select your Tooltip Viz to embed.
 |
| Main Viz |
You may format the Tooltip like you would previously - to show whatever fields you need to display, the size, font etc.


Comments
Post a Comment